Power BI Update – November 2020
- 2020.11.13
- PowerBI
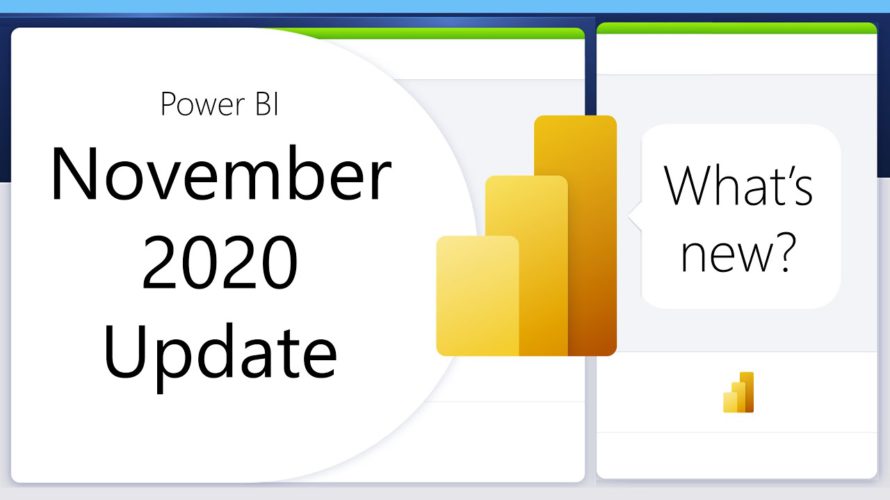
Our anomaly detection algorithm detects that there is an anomaly this month: Anomaly Detection is in preview! Also, we are announcing a preview of the new Field List and the Model View. We are adding a fan-favorite: the Visual Zoom Slider! In the Service, endorsements for datasets and dataflows are extended to reports and apps, enabling business users to be confident they are making decisions based on the right data. Read on to explore and discover more in this month’s update. #Microsoft #PowerBI
Reporting
New Field List (preview) — 00:15
New Model View (preview) — 1:01
Apply all filters is now generally available — 01:38
Visual zoom slider — 02:40
Data point rectangle select extended to Map visual — 3:05
Analytics
Anomaly Detection (preview) — 03:19
Q&A now supports partial matching data values — 07:18
Data Connectivity
Hive LLAP connector generally available — 07:41
New connectors — 08:07
Service
Certified and Promoted reports and apps — 08:55
The ‘new look’ of the Power BI service is live — 09:56
Embedded
Power BI Automation and APIs — 10:19
Power BI Embedded Analytics
New Q&A embed experience — 10:46
Enhanced samples for Power BI developers — 11:08
Visualizations
New visualizations — 11:28
Forecast visual by Predmac
Download — https://appsource.microsoft.com/en-US/product/power-bi-visuals/wa200002233?tab=overview
Global Launch Estimated by TheraTraq
Download — https://appsource.microsoft.com/en-US/product/power-bi-visuals/wa200002209?tab=overview
Lollipop Column Chart by Nova Silva
Download — https://appsource.microsoft.com/en-US/product/power-bi-visuals/wa200002253?tab=overview
Dynamic KPI Card by Sereviso
Download — https://appsource.microsoft.com/en-US/product/power-bi-visuals/wa200002081
Shielded HTML View by Nova silva
Download — https://appsource.microsoft.com/en-US/product/power-bi-visuals/wa200002144
TheraTraq Timeline Circle by TheraTraq
Download — https://appsource.microsoft.com/en-US/product/power-bi-visuals/wa200002115
Workforce by TheraTraq
Download — https://appsource.microsoft.com/en-US/product/power-bi-visuals/wa200002132
Updated visualizations — 11:59
Zebra BI 4.4
Learn more — https://www.youtube.com/watch?v=OgESqTNTmMg&t=0s
Download — https://appsource.microsoft.com/en-us/product/power-bi-visuals/WA200000805?tab=Overview
New visual by ZoomCharts: Drill Down Map PRO
Learn more — https://youtu.be/VzQWstYt5qc
Download — https://appsource.microsoft.com/en-us/product/power-bi-visuals/WA200002264?tab=Overview
xViz Scatter/Bubble chart
Learn more — https://www.youtube.com/watch?v=AkF-UgkrmyY
Download — https://appsource.microsoft.com/en-us/product/power-bi-visuals/WA200002313?tab=Overview
Editor’s Picks — 12:20
Bowtie Chart by MAQ Software
Download — https://appsource.microsoft.com/en-US/product/power-bi-visuals/wa104380838
Collaborate visual by valQ
Download — https://appsource.microsoft.com/product/power-bi-visuals/WA200000006
Collage by CloudScope
Download — https://appsource.microsoft.com/product/power-bi-visuals/WA104381540
Drill Down Donut PRO by ZoomCharts
Download — https://appsource.microsoft.com/product/power-bi-visuals/WA104381941
Developers
Fetch more data API 3.4 — 12:39
Enhanced testing of your developed custom visual — 13:16
Follow us on Twitter – https://twitter.com/mspowerbi. More questions? Try asking the Power BI Community @ https://community.powerbi.com/
-
前の記事

iPhone12 5Gが驚愕の速さだった件について Sub6でこんなに出るの?au 5Gで計測! 2020.11.12
-
次の記事

Chromebook : Google が目指した使いやすいパソコン。さぁ、Chromebook 2020.11.13