How to create a Gantt chart in Power BI (with a free visual!)
- 2023.02.04
- PowerBI
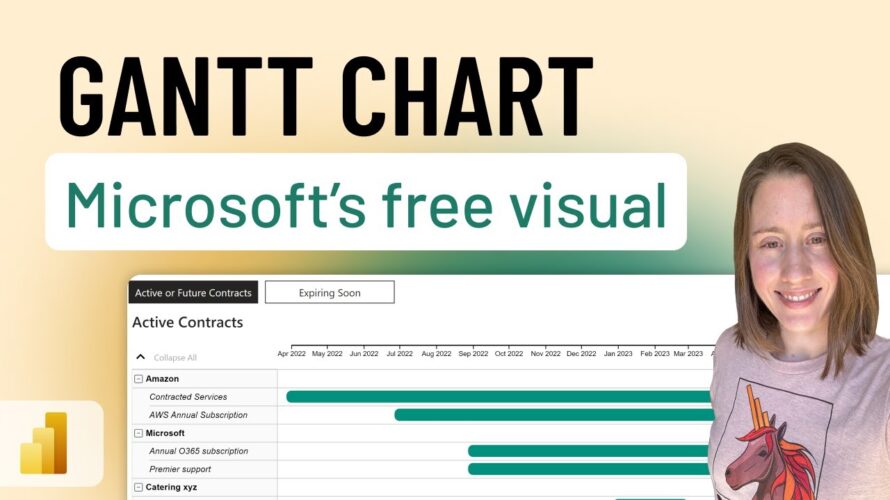
Gantt charts are typically used to track project progress, but they can be useful for any data that has a start and end date. In this video, we go over how to configure one in Power BI using Microsoft’s free custom visual from AppSource, adding bookmark filters to make it more user-friendly.
⏲️ TIMESTAMPS
0:00 Intro
0:20 Installing the visual
0:58 Power Query – get relative days from today
4:19 Configuring the visual
10:20 Creating bookmarked views
▶️RELATED VIDEOS
– Project & task data playlist: https://www.youtube.com/playlist?list=PLVWnQj3YS9wvbJves79UWCQLTMNXcviy_
– Gantt with milestones, dependencies, phases: https://youtu.be/5w1tdoCvyPM
– How to model and visualize the Planner data: https://youtu.be/eEmpzueZfqY
– Get Planner data for ALL your groups and plans: https://youtu.be/mqGFbIGpCcw
– Get Planner data for SPECIFIC plans: https://youtu.be/1UfxETalb9E
– Ping Planner assignees in Teams or Outlook from Power BI: https://youtu.be/8p2uXihLWrs
🪽 CONNECT WITH ME
– Blog: https://christine-payton.com/
– LinkedIn: https://www.linkedin.com/in/christinehpayton/
🎁 SUPPORT THIS CHANNEL
– Shop: https://shop.bi-ome.com/
– *Amazon – books: https://amzn.to/3B1bfDA
– *Amazon – gear I use: https://amzn.to/4dWBSrQ
DISCLOSURE
*Starred links are affiliate links. Purchasing through these links gives me a small commission to support videos on this channel. These are all items that I personally use and endorse; the purchase price is the same via these links vs direct.
💡 REQUEST NEW VIDEO TOPICS
https://forms.office.com/r/NTFBHH45gu
-
前の記事

Adding SBC for Direct Routing in Microsoft Teams (Basic Config) 2023.02.04
-
次の記事

【WiFi6 USB子機】無線なのに爆速!有線不要説を検証。TP-Link Archer TX20U Plus 2023.02.04