End-to-End Power BI: Master Power BI in One Tutorial!
- 2023.12.30
- PowerBI
Are you prepared to revolutionize your Power BI skills and emerge as a Power BI pro in just one transformative tutorial?
🚀 Welcome to the “End-to-End Power BI: Complete Power BI Mastery in One Tutorial” – a comprehensive 2.5-hour deep dive into the world of Power BI, taking you from the very basics to advanced techniques of a Power BI Project. 🌐✨ This tutorial is crafted to ensure you not only learn but master the art of Power BI from start to finish, offering an end-to-end exploration of a Power BI project.
💡 Why Choose End-to-End Mastery?
This tutorial goes beyond the surface, providing a holistic view of Power BI’s capabilities. By the end, you’ll be equipped to handle every aspect of Power BI, from the foundational steps of data preparation to the implementation of advanced visualization techniques.
🎓 Who Should Watch:
• Power BI enthusiasts eager to master the end-to-end process.
• Analysts and professionals seeking a comprehensive understanding of Power BI capabilities.
• Anyone looking to create impactful dashboards and visualizations with Power BI.
🖥️💡 Follow along using the same file!
https://github.com/powerbibro/powerbibro
🛠️ Resources Mentioned:
Kaggle Netflix Dataset
https://www.kaggle.com/datasets/snehaanbhawal/netflix-tv-shows-and-movie-list
Coolors Gradient Creation
https://coolors.co/gradient-palette/e50914-ebeaea?number=10
Netflix Branding
https://brand.netflix.com/en/assets/logos/
Remove Image Background
https://new.express.adobe.com/tools/remove-background
📚 Chapters:
1. Introduction
• Set the stage for your Power BI mastery journey with an overview of what’s to come.
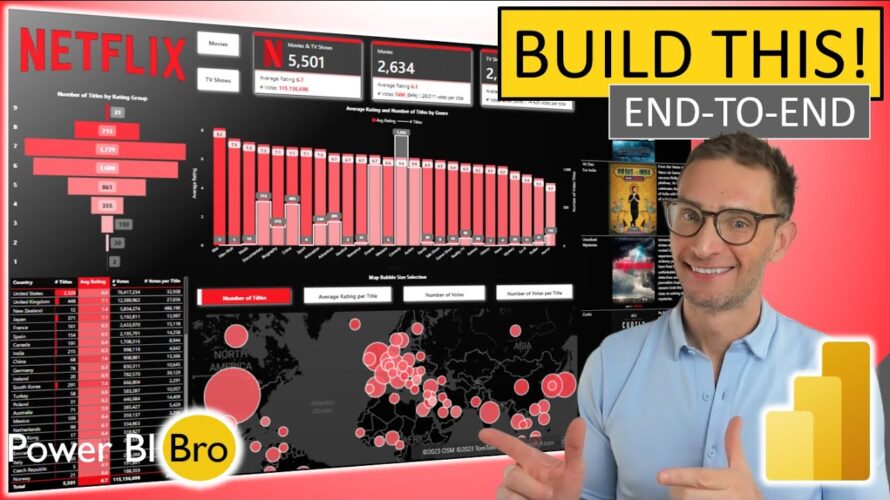
2. Dashboard Overview and Intent
• Understand the fundamentals of dashboard design and the intent behind crafting impactful visual stories.
3. Data Preparation & Ingestion
• Power BI’s strength lies in its ability to transform raw data into meaningful insights. In this chapter, we delve deep into the end-to-end process of data preparation and ingestion. Learn how Power BI’s robust features simplify the transformation of raw data into structured datasets, setting the foundation for insightful analyses.
4. Data Model
• Explore the backbone of Power BI – the Data Model. Learn how to structure and optimize your data for efficient analysis.
5. Dashboard Background and Image
• Elevate the visual appeal of your dashboards by understanding the power of background customization and image integration in Power BI. Learn how to customize the look and feel of your dashboards, ensuring an end-to-end visual experience that captivates your audience and communicates insights effectively.
6. Funnel Chart
• Uncover the power of Funnel Charts. Master their creation and integration into your dashboards.
7. New Card with Reference Labels
• Elevate your data representation with the new card visual in Power BI. In this chapter, we explore the end-to-end process of creating impactful New Cards with reference labels. Understand how to leverage this feature to communicate key metrics and insights seamlessly within your dashboards.
8. Table with Images
• Learn how to enhance your tables by incorporating images for a richer data experience.
9. New Slicer Filter
• Dive into the functionality of the new slicer filter in Power BI. This chapter takes an end-to-end approach in exploring how to dynamically and interactively filter your data. Learn the nuances of the new slicer filter, ensuring your dashboards provide a responsive and tailored experience to your audience.
10. Bar Chart with Secondary Stepped Line Axis
• Master the creation of Bar Charts with Secondary Stepped Line Axes for advanced data comparison.
11. Table with Databars and Conditional Formatting
• Elevate your tables with Databars and Conditional Formatting for clearer insights.
12. Azure Map with Size Parameter Filters
• Conclude your Power BI mastery journey by exploring the integration of Azure Maps with size parameter filters for dynamic mapping.
🕒 Timestamps:
0:00 – Introduction
01:25 – Dashboard Overview and Design Intent
07:34 – Data Preparation and Ingestion
19:18 – Data Model
38:46 – Dashboard Background and Image
46:09 – Funnel Chart
57:44 – New Card with Reference Labels
1:25:25 – Table with Images
1:42:02 – New Slicer Filter
1:52:20 – Bar Chart with Secondary Stepped Line Axis
2:06:22 – Table with Databars and Conditional Formating
2:13:09 – Azure Map with Size Parameter Filters
👍 Ready for an immersive Power BI experience? Hit play now and embark on the journey to become a Power BI master! Don’t forget to like, share, and subscribe for more data-driven adventures! 🚀📊
#powerbi, #powerbibro, #powerbidesktop, #powerbipro, #powerbitutorial, #datavisualization, #netflix, #businessintelligence, #dataanalytics, #dashboard, #datamodeling
-
前の記事

LPG Gas e KYC Online || Bharat Gas e KYC Online 2024 || Bharat Gas eKYC Kaise Kare || LPG eKYC Apply 2023.12.30
-
次の記事

Magcubic Projector Hy300 4K 2023.12.30