Wireframing Power BI Dashboards from Scratch (with AI) | A Design Thinking Approach
- 2025.10.03
- PowerBI
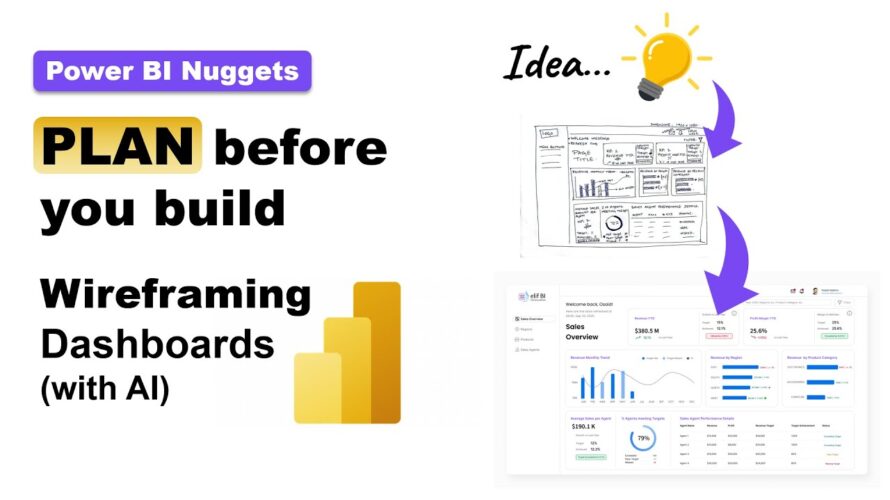
Before you start building in Power BI, it’s essential to plan and wireframe your dashboard. In this tutorial, I’ll walk you through a step-by-step design thinking process for creating effective dashboards — even if you’re a beginner or you don’t know much what to do with the given dataset.
You’ll learn how to:
✅ Define the purpose and audience of your dashboard
✅ Align KPIs with business goals and strategic objectives
✅ Review your dataset and understand its structure
✅ Use AI (like ChatGPT) to brainstorm KPIs, storytelling flow, and visuals
✅ Sketch low-fidelity wireframes to save time and avoid rework
✅ Discover online tools to create high-fidelity wireframes with AI Prompts
Video Chapters:
00:00 Intro
01:06 Video Flow
02:37 Step 1 – Decide the Dashboard Purpose
08:01 Step 2 – Identify Audience & Decisions
13:25 Step 3 – Dataset Review (fields & data quality)
14:58 Step 4 – Business Objectives – the big goals
18:15 Step 5 – Defining Core KPIs
22:42 Step 6 – Storytelling Flow
28:11 Step 7 – Information Architecture – the “blueprint”
33:11 Step 8 – Mapping KPIs to Visuals
33:44 Step 9 – Low-Fi Wireframe
35:26 Step 10 – Interactions & Filters
37:28 Step 11 – High-Fi Wireframe
40:25 Claude.ai
43:53 Mokkup.ai
46:02 Figma
55:02 Step 12 – Refine & Iterate
You can download the prompt files and dataset here:
https://topmate.io/osaidhashmi/1755626
Prompts discussed in the video: ChatGPT_PowerBI_Wireframing_Prompts
Dataset discussed in the video: Wireframing Power BI Dashboards_Dataset
Some Random Prompts you can try: Random_Dashboard_ChatGPT_Prompts
Video for creating High-Fidelity Wireframe in Figma:
These steps can be applied to explore any dataset and draft dashboards with actionable insights.
Subscribe for more Power BI tips and tutorials:
@LetsTalkData101
LinkedIn: https://www.linkedin.com/in/osaidhashmi/
My websites:
https://elifbi.com/
https://topmate.io/osaidhashmi
I post content regularly on Power BI dashboard design, DAX, and productivity tools.
💬 Got questions or favorite tips of your own? Drop them in the comments — I’d love to hear how you design your reports!
▬▬▬▬▬▬▬▬▬▬▬▬▬▬▬▬▬▬▬▬▬
Some of the most useful books on POWER BI
** Data Visualization with Microsoft Power BI
https://amzn.to/464Cbzl
** Learn Microsoft Power BI
https://amzn.to/46C0DIC
** The Definitive Guide to DAX
https://amzn.to/4ptnOMS
As an Amazon Associate, I earn from qualifying purchases.
▬▬▬▬▬▬▬▬▬▬▬▬▬▬▬▬▬▬▬▬▬
Music Credits:
▬▬▬▬▬▬▬▬▬▬▬▬▬▬▬▬▬▬▬▬▬
Corporate Business Background by Wavecont
Music provided by https://protunes.net
Video Link: https://bit.ly/4ajV7ui
▬▬▬▬▬▬▬▬▬▬▬▬▬▬▬▬▬▬▬▬▬
#PowerBI #PowerBIDashboard #DashboardDesign #aifordevelopers #Wireframing #DataVisualization #DashboardBlueprint #DataStorytelling #BusinessIntelligence #ElifBI
-
前の記事

Cómo usar Samsung DeX en Galaxy Tab S11 Series | Samsung 2025.10.03
-
次の記事

TraitWare Office Hours – OTPs, Mobile MFA, and Moving Beyond Passwords 2025.10.03